Describing functions
For nonlinear systems consisting of a feedback connection between a
linear system and a static nonlinearity, it is possible to obtain a
generalization of Nyquist’s stability criterion based on the idea of
describing functions. The basic concept involves approximating the
response of a static nonlinearity to an input  as an output
 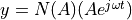 , where
  represents the (amplitude-dependent) gain and phase
associated with the nonlinearity.
represents the (amplitude-dependent) gain and phase
associated with the nonlinearity.
Stability analysis of a linear system  with a feedback
nonlinearity
with a feedback
nonlinearity  is done by looking for amplitudes
  and frequencies
  such that
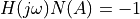
If such an intersection exists, it indicates that there may be a limit
cycle of amplitude with frequency .
Describing function analysis is a simple method, but it is approximate because it assumes that higher harmonics can be neglected.
Module usage
The function describing_function() can be used to
compute the describing function of a nonlinear function:
N = ct.describing_function(F, A)
Stability analysis using describing functions is done by looking for
amplitudes  and frequencies :math`omega` such that
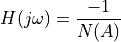
These points can be determined by generating a Nyquist plot in which
the transfer function  intersections the negative
reciprocal of the describing function
intersections the negative
reciprocal of the describing function  . The
. The
describing_function_response() function computes the
amplitude and frequency of any points of intersection:
response = ct.describing_function_response(H, F, amp_range[, omega_range])
response.intersections      # frequency, amplitude pairs
A Nyquist plot showing the describing function and the intersections
with the Nyquist curve can be generated using response.plot(), which
calls the describing_function_plot() function.
Pre-defined nonlinearities
To facilitate the use of common describing functions, the following nonlinearity constructors are predefined:
friction_backlash_nonlinearity(b)     # backlash nonlinearity with width b
relay_hysteresis_nonlinearity(b, c)   # relay output of amplitude b with
                                      # hysteresis of half-width c
saturation_nonlinearity(ub[, lb])     # saturation nonlinearity with upper
                                      # bound and (optional) lower bound
Calling these functions will create an object F that can be used for describing function analysis. For example, to create a saturation nonlinearity:
F = ct.saturation_nonlinearity(1)
These functions use the
DescribingFunctionNonlinearity, which allows an
analytical description of the describing function.
Module classes and functions
Base class for nonlinear systems with a describing function. |
|
Backlash nonlinearity for describing function analysis. |
|
Relay w/ hysteresis nonlinearity for describing function analysis. |
|
|
Create saturation nonlinearity for use in describing function analysis. |